
3D Plotting Example Problem
Alternatively, you may create a new input file by pasting the text below into the input window:
Test 3D sphere input file
    1     1  -1         -1
    2     2  -1         -2  1
    3     0  2

    1        so        100
    2        so       5000
   11        px        -40
   12        px         40
   13        py        -40
   14        py         40
   15        pz        -20
   16        pz         60

mode  n
m1    1001.                 1 $MAT
m2    1001.                 2 $MAT
imp:n  1            1r           0            $ 1, 3
sdef
print
ctme  100.0
nps 100000
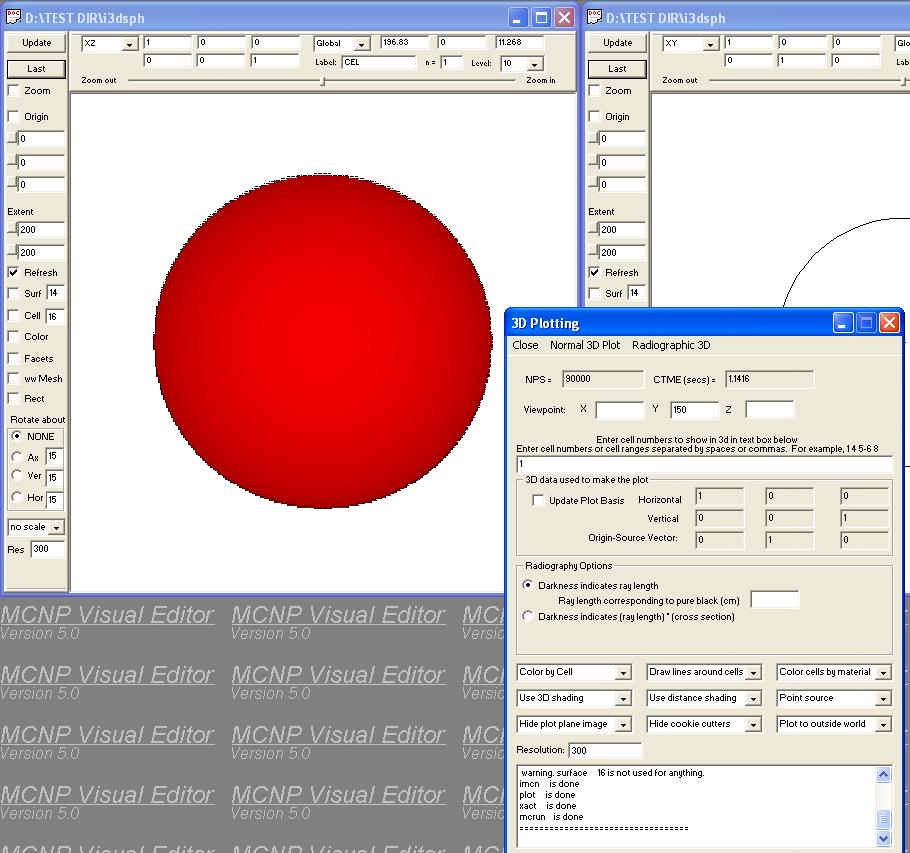
To create a 3D plot of this input file:
The plot should appear as above.
|
Website maintained by
Alysia Schwarz
(Last Updated: 7/24/2003) | ||