
Reading MCNP data into Excel (2002).
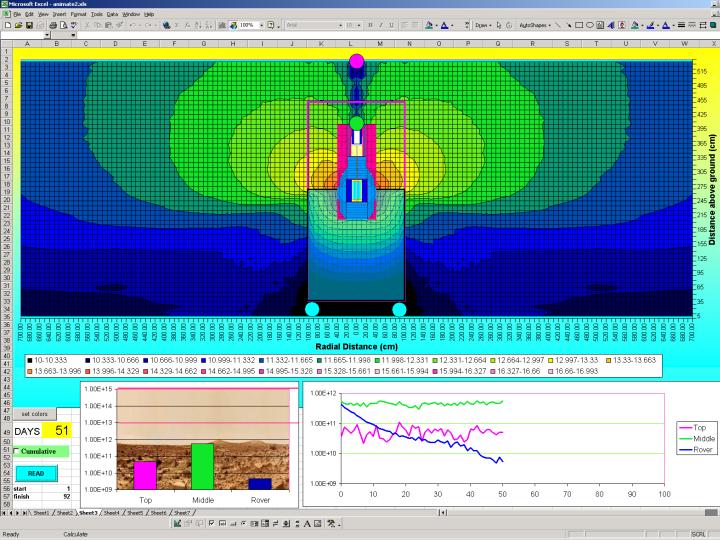
This figure is a frame from an animation showing a liquid carbon dioxide shield
filling a cavity around a reactor. Unlike previous animations, this one used
Excel instead of expensive graphics software. The MCNP data is read in from a "mctal"
file generated by MCNP and then the data is plotted in Excel.
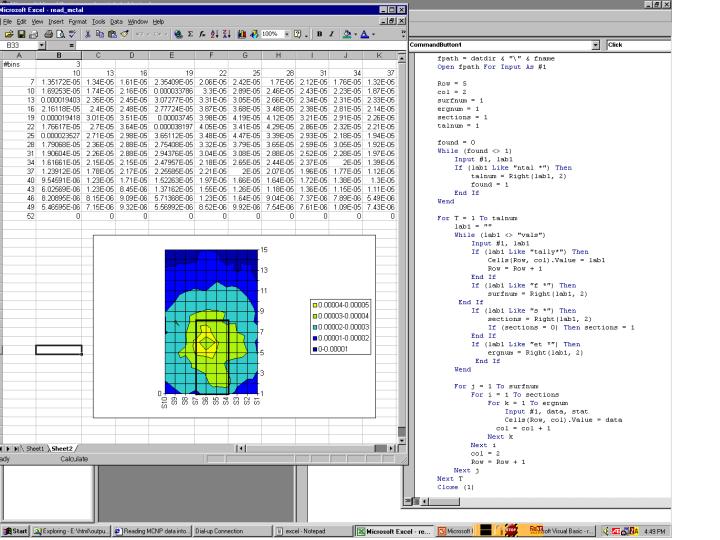
The figure above shows a simpler example of how to read and display MCNP
data in Excel. The MCNP input file for this example is one that is
created in the Visual Editor class. The input is run and a mctal file is
generated. The mctal file is read in by Excel using the visual basic
script shown here. This is done on sheet 1. Sheet2 (shown above) is used
to manipulate the tally data read in on sheet1 and make a contour plot.
To adapt this to your specific needs, you will need to modify the script
to correspond to the type of tallies you ar using.
You should be able to generate the mctal file provided above on your own by running MCNP. To view the Visual Basic script in Excel you need to select View->Toolbars->Control Toolbox. Next select the "Design Mode" icon, then right click on the "read" button and select "View code".