Radiographic Plotting
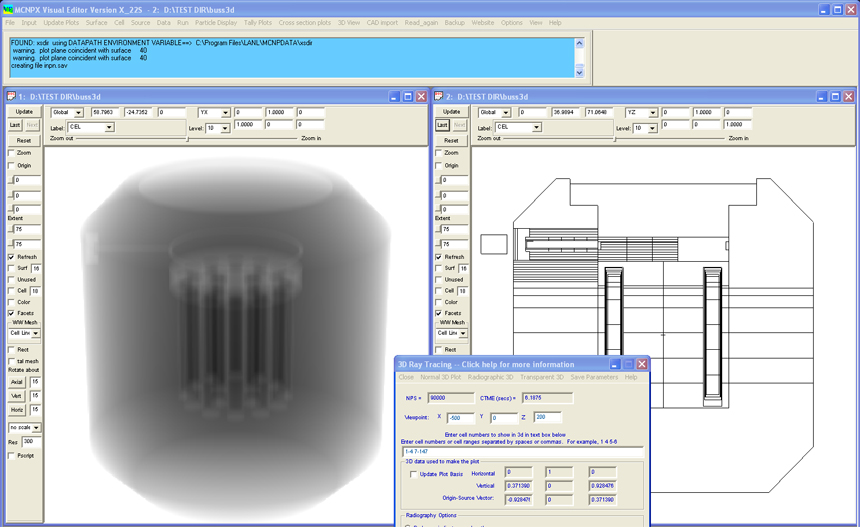
A radiographic plot is a 3D plot where the darkness of the plot represents either the total thickness of the cells that the ray has passed through or represents the cross section of the material for a user specified incident source energy. In this figure a source energy of 1 MeV is used and the maximum length is set to 80.7 cm. This length is verified in the output at the bottom of the 3D plotting window.
A couple of features that can be noticed in this radiographic plot, are the different capsules inside the cask (high density) and the presence of a vent port (low density) near the top right portion of the cask.
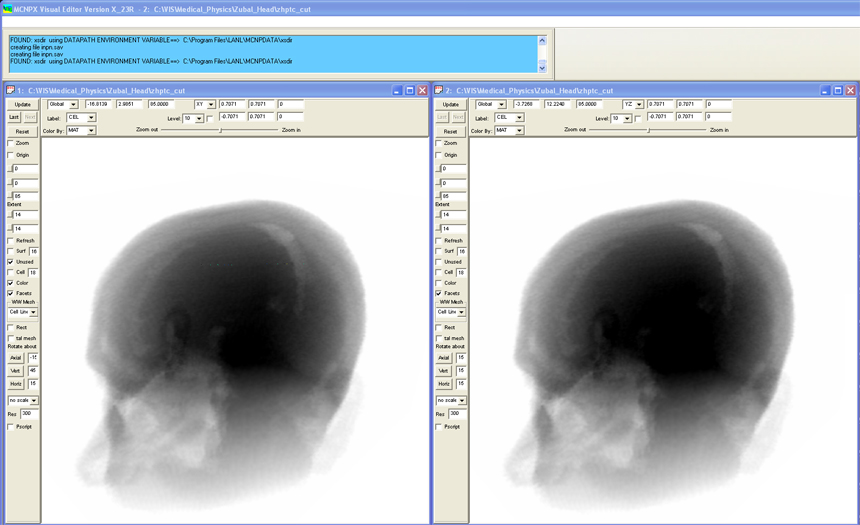
Below is a radiographic plot of a human brain.