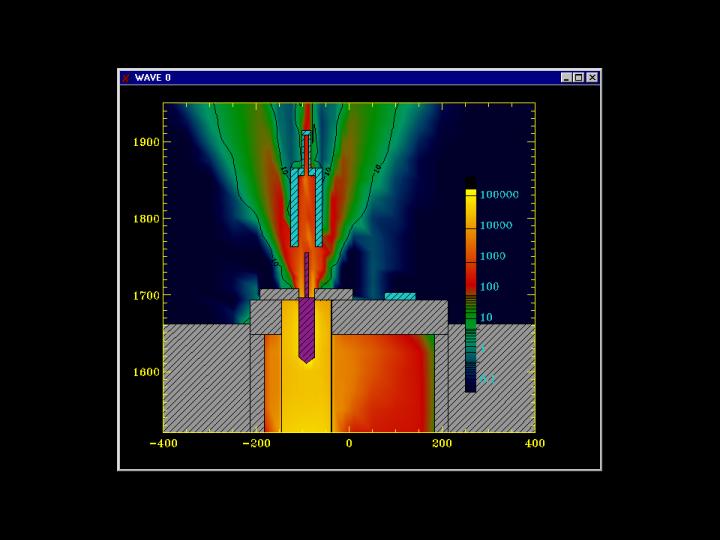
Dose animation of a tank sampler (1993).

This figure is a frame from the first animation that I did in 1993 using MCNP
data. These calculations used a point kernal approximation of MCNP to reduce the
amount of time required to make the calculations. We wanted to determine the
dose rates that would occur if a sample of waste was removed from one of the
tanks at Hanford.
This animation shows the waste inside the sampler being pulled to the
top of the tank. Next a bottom loading transfer cask is positioned above
the sampler. The shields above the sampler are then removed. The cask is
moved down on top of the tank and the sample is then pulled up inside
the cask.
