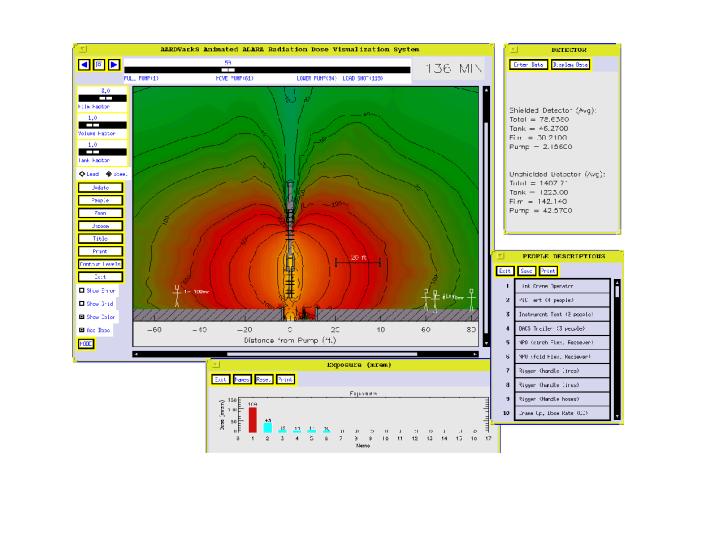
ALARA animation for a contaminated pump (1994).

This figure shows an As Low as Reasonably Achievable (ALARA) tool based on over
2,000 hours of MCNP calculations. These calculations were in support of the
removal of a contaminated mixer pump from a waste tank. The dose rates for this
operation were anticipated to be very high, so it was requested that ALARA
calculations be made to better understand the dose rates and how they could be
reduced. Dose rates were calculated on a 2D grid for the three major dose rate
locations: the waste tank; the region inside the pump; a thin film outside the
pump. These dose rate grids where then combined by the graphics program to
generate the cumulative dose rate fields. By dividing the dose rate into its
three components, the magnitude of each source could be changed without having
to redo the calculations.
The complete process of removing the pump from the tank and placing it
in a storage cask was simulated in MCNP and the dose rates were
calculated for key steps in the process. This data was then visualized
by the ALARA tool that was developed for the ALARA engineer. The ALARA
engineer was then given the capability of inserting "stick figures" into
the plot window and the program would then calculate the cumulative dose
rate at the location of the stick figures. In each frame of the process,
the ALARA engineer was allowed to move the location of the stick
figures. With this capability the ALARA engineer could create fairly
accurate dose rate assessments for the operations being performed.
