
3D Particle Track plotting.
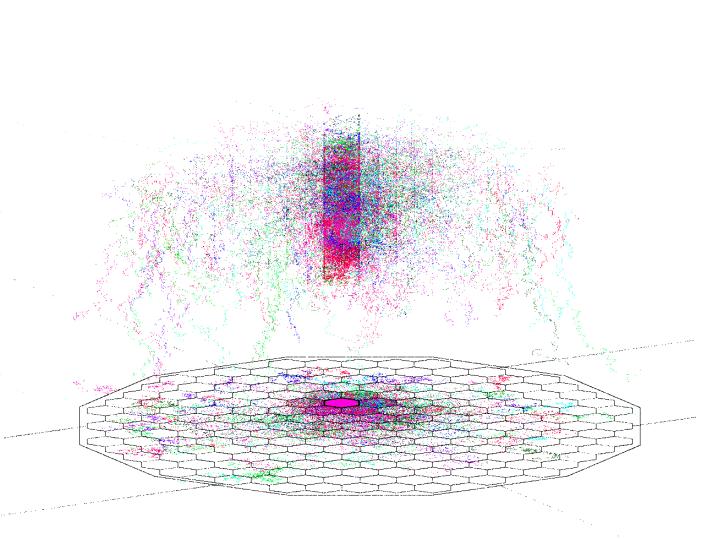
This figure shows a plot of particle tracks in a reactor from an MCNP run. Every detail in this figure is generated from a particle track. The outline of the core at the bottom of the plot was generated by plotting the surface crossings and projecting them on a 2D plane. The remaining tracks, represent individual particle paths. In this plot, the axial dimension is energy. Thus as you look at the outer regions of the reactor, the particle paths go further down since these particles lose energy in the reflector region of the reactor. The different colors represent different particle tracks. Also shown in this plot is the particle biasing. In this case, the particles are being biased toward a test assembly near the center of the reactor. The reactor modeled here is the Fast Flux Test Facility and the test assembly is a Materials Open Test Assembly.
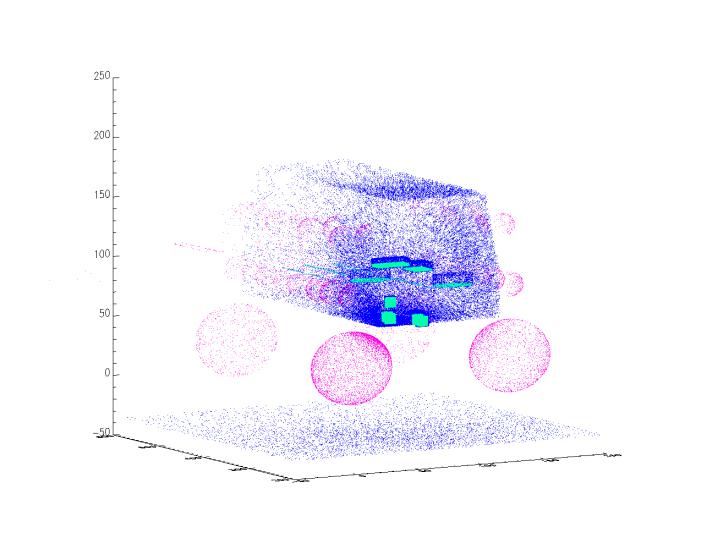
This figure shows a plot of particle tracks in a glovebox. Every detail in this figure is generated from a particle track. The source objects inside the glovebox are shown in light green. The sides of the glovebox and the floor are shown in blue. The tally spheres are shown in red. This plot was generated by plotting the coordinates of all the surface and tally crossings and then projecting them in three dimensional grid. Notice that locations that have more color indicate more particle tracks. Thus it can be seen that the highest dose rate will be to the large tally sphere closest to the viewer.